Tuesday 30 June 2009

Nifty Fifty - Possible head and shoulders top


This set up is actually better seen by looking at the Sensex as the neckline was tested as resistance today just perfectly, but I do not have access to the data today! In any case there appears to be the potential for a head and shoulders top with a target back at the 3600 region close to where I initially targeted. It should be initiated on a push below the neckline or 4143.25 to be sure. This is the scenario that I favour, so good luck to all those who have a go!

Monday 22 June 2009

OMX - First signs that the bears are taking control


Following on from my earlier post on the OMX, today's price action definitely shows the bears are beginning to take control of this market. As can be seen in the chart above (click on chart for a larger image) the OMX has had a false break higher to 810.03 followed by weakness which has broken minor trend-line support and also closed below 755.53. This now warns that bears are in control and as detailed in my earlier piece I still favour a fresh low in this market.


Sunday 21 June 2009

BUND - Possible reversal pattern


As is detailed in the chart above we have seen a bullish false break lower in the Bund on a daily chart and a reversal pattern has formed. A break over 120.00 will trigger further gains towards 122.00 and possibly higher. I have also shown the Dax in the lower portion of the screen to highlight the general inverse relationship. So, with that in mind, could the movement in fixed income be signalling the end of the bull run in stocks? For further thoughts on the links between bonds and stocks take a look here. Also, as an after thought, the Dax has broken out of a well defined bullish channel to the downside......

EUR Index - Possible technical signs of weakness


For a change I thought I would take a look at the EUR index as I always focus on the USD Index. The EUR index is interesting as it is has been trading in a symmetrical triangle. There was a bullish false break lower which occured in mid April, however strength has since failed by old trend-line resistance and has fallen back below the old support. If this break is maintained and given that the EUR is the biggest component of the USD Index this perhaps gives extra weight to the possibility of USD strength in the pipeline. A decisive break under 114.983 will signal medium term weakness in the EUR. As always, click on the chart above for more details.
Most of us are aware of the failure of many European banks to give any insight at all into the state of their balance sheets. Industrial production continues to be poor in Germany and most ECB bankers seem to be on a different planet from the rest of us. If there is no demand from elsewhere it does not matter if you have a low level of consumer debt (ie Germany), as somebody still needs to buy your products. Also, given the stubbornly low levels of inflation in the eurozone, it seems to be setting itself up nicely for a Japanese style lost decade. If you're suffering from deflation what you need is a weak curency not a strong one, therefore I am biased down for this index.

Saturday 20 June 2009

GBPCHF - Extension higher favoured.


GBPCHF has broken above the pivotal level of 1.7490 as mentioned in my prior post. Given the shallow retrace to 1.7120 and swift rejection lower seen last Thursday I see a long position as a good diversification of being short EURGBP. This ties in with a medium term view that EURCHF is headed higher, although I would not rule out a swift return to 1.4800 in EURCHF before substantial strength higher. Fundamentally I see the reality of the world economy as being much the same as it was back in 2007 when the mayhem began. US consumers, the linchpin of the global economy, are still heavily leveraged. Given that the US consumer is not coming back anytime soon this implies that US GDP will do the same and with it earnings expectations for the S&P500 are probably a tad too optimistic . In this scenario the tug of war between two currencies like the Swiss Franc and Sterling just turns into a technical arguement as to which one is the most overextended on the downside given their dependence on finance. My opinion is clearly in favour of Sterling although this may begin to change if and when I see EURGBP at levels below .8223 and GBPCHF over 1.9000. In the meantime I favour extensions in both currency pairs, although cable may be capped around 1.6685. In terms of targets for GBPCHF please refer to my prior post. A push back below 1.7120 however warns of an end to strength and it would be wise to take a step back and re-assess.

Nifty 50 - Brief update and trade recommendation


The Nifty almost touched the bottom of the range of values at which I recommended to go short namely 4700 - 5000. As can be seen in the chart above it now trades just above trend line support. It is possible that we get a bounce from here that may give another shorting opportunity within the afore mentioned range. Given the price action in the S&P 500 I still favour weakness and combining that with my bias from the emerging/developed analysis below I favour an eventual break beneath this trend line. My ideal scenario is a return to the range that was trading before the post election madness, between 3300 and 3700. I would suggest selling pullbacks up to 4450 with a stop over 4550. Alternatively wait to see if it gets back into the range that was mentioned earlier; the option for the truly safe trader. As always good luck.

Note on links to FT articles

I have been told by a few readers that the links to some of the FT articles I have suggested are taking them to subscription pages. One potential way round this is to click on the link I have provided and then copy and paste the title of the FT story into a fresh google search and then look for the FT article amongst the search results (should be in the first 5 or six). 50% of the time you get to the article you wanted originally but without the subscription garbage. Hope this helps some of you.

Monday 15 June 2009

Developed versus emerging markets - Can we learn anything from their relative movement?


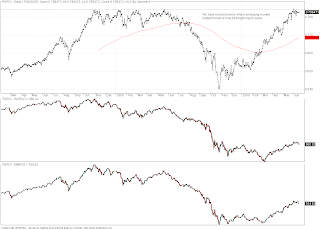
Above you can see three charts all in the one frame. The orientation of the data is as follows, starting from the bottom we have the Morgan Stanley Emerging markets index, above that the World index from the same provider, and right at the top we have the ratio of the two, calculated by dividing the value of the emerging markets index by the world index (developed markets).

As the ratio rises this is showing you that emerging markets are outperforming developed markets and this has been the case since the end of October last year when the emerging market index bottomed. Note that the world index made a fresh low after October, in March which was not matched by the emerging world. Conversely when the ratio falls the opposite is true. In that case developed markets will outperform.

Although I appreciate there is not a lot of history we can see that when the ratio hit these levels last year it marked a high point for equities and the end of the outperformance of the emerging markets. Given my view on some emerging markets and India in particular I think that we could see outperformance again in developed markets. I feel that the S&P must at the very least test the low that was made in March, be it a 50%/60% or greater retracement. If that is the case emerging markets are not the place to be in the short run.


I would like to stress that I am a long term bull on the Indian markets in general, but feel that we have gone a long way in a short while on essentially hot air as per my recent posts.

Thursday 11 June 2009

The Coppock Indicator - A great article

I'm sorry about the lack of original ideas at the moment part of it is down to me waiting for a resolution to the S&P 500. Along those lines take a look here at a letter from the FT today. I've been reading a lot about talk of this indicator recently and found this letter highly relevant.

will update more at the weekend.

Sunday 7 June 2009

A good article on where we are economically from a global perspective.

Another one from Ambrose Evans-Pritchard at the Telegraph: Take a look.

OMX, Swedens stock market - Weekly structure suggests further downleg


Continuing from my post below about the USD index, I feel that the OMX cash index has a very clear bearish structure which will only be broken on a rise over the 801.54-816.35 region. However, while below this area there is a large probability that we make a fresh low below 556.77. This also offers a clear trading opportunity with a great risk reward profile. I would suggest selling at market or on pullbacks under the above mentioned region. Your stop is clear (over 801.54-816.35), and the initial target is 556.77. Good luck!

USD Index - Has it bottomed?


The USD index has bounced from close to the 61.8% retrace of the prior rise. Could this possibly be a turning point for the Index. If so it could also mark a turning point for equity markets as the USD being bid will probably be associated with stress in risk markets.


My own view given positioning in USD shorts is that we are close to a turning point. For the purposes of this blog I am simply pointing out that, as before, the USD index may be key to direction elsewhere.

Wednesday 3 June 2009

Richard Koo - FT today

Great article from Richard Koo in the FT today. He sums up what I have been discussing in a couple of recent posts about what a waste of time S&P is in the medium term (http://you-buy-the-high-i-sell-the-low.blogspot.com/2009/05/if-s-had-rating-it-would-be-junk.html). Check it out:

http://www.ft.com/cms/s/0/c3654cdc-4f88-11de-a692-00144feabdc0.html

GBPAUD - Divergence implies strength ahead


As can be seen from the weekly GBPAUD chart above there is a rather large weekly bullish divergence. Given the over extended nature of the recent bounce back in AUD, I think this trade can be justified. I also see a volatility breakout on the horizon and given the divergence set up I favour a push higher. Move could be fast brace yourself.

Monday 1 June 2009

AUDNZD - Opportunistic trade recommendation

Just been looking at the AUDNZD chart and would suggest buying on pullbacks towards 1.2400 with a stop under 1.2300 and a target back at 1.2940. Good risk reward and great fundamentally and technically. NZDUSD may have also completed a symmetric correction. Perhaps more on that tomorrow. Goodnight!

Interesting - Yield curve spread and equities

Good piece on The Big Picture that ties in with my piece yesterday about the rise in 10 year yields and the movement of equities. Take a look:

http://www.ritholtz.com/blog/2009/06/relationship-between-the-210-spx/