Thursday 3 December 2009

Nifty 50 - Possible p/e based warning sign....


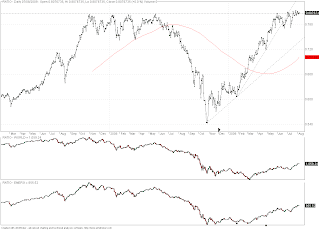
So here is the promised update on India's Nifty50 stock market. I have highlighted, as on previous occassions, the prior time that equity markets where stimulted and p/e's reached these levels. As we can see the markets fell about 35% back at the beginning of 2004 . I intend to get some data to compare developed versus emerging stocks and will hopefully have that by tomorrow. Definitely food for thought.....

Talking of running just to stand still.......


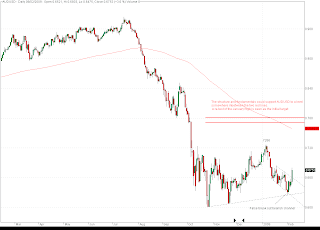
As each day goes by and new bits of economic data are released I find myself looking at the S&P500 and thinking of the cartoon roadrunner and Wile E Coyote. I can't help but think of these markets as being so euphoric on the back of garbage that it reminds me of the moment in every episode when the coyote winds up running off the edge of a cliff and for a moment is suspended in disbelief about what is about to happen. Are we there yet as far as markets are concerned? Well contrary to many I believe that emerging market equities are a sell and in particular the Indian ones. I will update shortly with my usual p/e based reasoning. I guess there is no accounting for how far a bit of stimulus can take the raging crowd....

In the meantime enjoy the cartoons above.....

Sunday 22 November 2009

Running just to stand still

Morning!

So we have had countless stimulus packages in various flavours in various countries and the end result is anemic growth almost everywhere apart from the UK which is apparantly still contracting. This is just a re-run of the events that took place in Japan in the 90's. Admittedly, goodness knows what things would be like if there was no stimulus at all. In any case what we do know is that Japan had periods of positive gdp AND a relatively strong labour market and they still suffered massive asset price deflation. By the way anyone who wants a good big picture view of the potential for deflation should read Roger Bootle's series of three books; The death of inflation, Money for nothing and his most recent one, The trouble with markets.
The way to solve the problem of excessive debt is not to issue more. The obvious thing to do is to pay it back? This is exactly what happened in Japan. Private debt was, and is, being paid back. This is why banks are not lending and businesses on the whole are not borrowing. I believe Mervyn King was right when he said some months ago at an inflation report press conference that in the short run we have to do the complete opposite of what is right for the economy in the long run. So in the short run excess government spending has been the appropriate economic medicine to avoid armageddon. There is a possibility that governments can stimulate their respective economies back to their pre crisis highs and perhaps beyond but without an increase in lending it seems unlikley this will occur. As I have mentioned in a post from months ago I think the Nikkei is a great roadmap for what may happen in the Anglo Saxon world. Every time there is a rise in optimism and equities rise, the smart people get out, learn from their mistakes and return to a more balanced approach to investing. This process repeats many times and eventually the system is cleansed. It is essentially what Mervyn King was talking about but it will probably need to happen many times because it is simply too dangerous to let all economic agents fail, that need to fail, all in one go. Thus it is done in stages as per the Nikkei chart over the last 20 years.

It is my belief that we are going to experience at least one more credit contractionary phase. As a proportion of outstanding debt, USD denominated debt is the largest. If folk start scrambling to get the money back that they have lent out, the end result is a monumental USD rally that comes from out of the blue. USD sentiment is near an all time low. Note, that when the USD rallied following the collapse of lehman it reached a point at which 98% of USD speculators were bullish USD. Guess what? That was the point to sell USD (around March 09). Now we are at a point where about 3% of speculators are bullish USD. In my mind it is a reasonable place to build small long USD positions.
Take a look at the NZDUSD chart above. It is one of the few USD pairs that has broken below trend-line support and I believe is one that should be sold aggressively on pullbacks towards .7450. Unfortunately I do not have access to my normal charting package so I am trying out an alternative. Let's just say that the false break higher that occured on 21 October followed by the breach of the support of a rising daily wedge and then the major trend-line support off the lows from March/April is an early warning sign of probable further losses. As always, good luck if you have a go.

Thursday 19 November 2009

Pastures new

Dear all,

I just wanted to let my faithful readers now that I have been away for a while as I started a new job a month ago(doing the same thing). I hope to return to the blog shortly. I remain a dollar bull in the short run for those who are still interested. Will be back soon.

Sunday 4 October 2009

Good article via The Big Picture from Barrons

Good perspective on the jobs outlook in the US:

http://www.ritholtz.com/blog/2009/10/the-more-you-dig-into-the-numbers-the-worse-they-get/

Great insight from Pimco's El-Erian

A great article in last weeks FT from the joint CIO of Pimco:

http://www.ft.com/cms/s/0/1551b95e-ac59-11de-a754-00144feabdc0.html

AUDUSD - Closes below .8700 for the third week in a row.


As can be seen in the (weekly) chart above AUDUSD has once again finished the week below the .8700 extension target. In doing so on Friday, it also attempted to break below the wedge support that I have highlighted. A break below this support will be bearish.

I appreciate that I am focusing on the one currency that has a central bank that is supposedly going to raise rates. However, what evidence have we had in the last few weeks that there is a case for rate rises? Ok, domestically the Aussie economy may be printing stats that are mildly bullish. If only Australia was able to exist in isolation that would be fine. As far as I am concerned stats coming out of other regions have been those that suggest a double dip, particularly Chicago PMI and NFP in theUS (including the 800K downward revision). Now if the the Anglo Saxon world is possibly going to experience a double dip recession what does that say for the demand for Chinese goods and then in turn for Aussie output (commodities)? No country can survive in isolation and there is no such thing as decoupling. I therefore think that there is a risk that even if the RBA raises rates that they will have to stop after one, and what the forward market is pricing in will be scaled back. The Aussie is a play on global growth and I don't see that being too rampant. For me the best risk reward is in a disappointment from the RBA, which may best be reflected via an options play. That is down to individual risk tolerance. Good luck.

Sunday 27 September 2009

USD Index - Falling wedge. A potential false break lower


As can be seen in the weekly chart above, the USD index has been forming a falling wedge which broke to the downside over the last 3 weeks. Interim support has been found,pushing back into the wedge and now needs to be maintained in order to leave a bullish false break lower. Failure to hold here will likely lead to a break towards last years low at 70.698. However, if maintained and a break of the wedge resistance is achieved, this will confirm the false break lower and will be a signal of USD strength ahead.
So, we are at a pivotal point in the market. Will the USD strengthen and likely take equity markets down with it, or are we about to see an extension of recent weakness in the USD associated with further strength in already overvalued equities? I know which camp I am in. Is a larger multi-month/year reversal pattern forming here? What say you?

GBPUSD - How weakness in GBPUSD effects EURGBP


The reversal pattern that I mentioned in my post below has now been triggered. I think we are heading to the 1.5300 region initially. If and when we get there I think it will be perfectly feasible that 1.3500 will be mentioned again by so called experts. Prices make opinions, not the other way round.
One thing to note here is that when cable is weak, EURGBP tends to rise. I think there is every chance that we head back to .9805 in EURGBP and possibly higher. In saying this I assume that there are no balance sheet surprises out of the Eurozone banking system and that Eurozone investement grade credit spreads do not deteriorate relative to their UK equivalents. So ask yourself this; if EURGBP heads to parity, where does that leave cable? Above is a chart of Cable with EURGBP below it, so that you can see the general inverse relationship. Periods where this is not the case are short lived.

I am certain that the Eurozone banking system is in a complete mess, but for some reason Mr Market has decided to ignore this. Maybe if trade begins to contract again and Germany feels the pain this will resurface, but in the meantime there is no point arguing with the market as this has the potential to be an explosive one. A good article about global money supply which ties in with growth and debt deflation can be read here. Enjoy!

Saturday 26 September 2009

NZDUSD - Meets extension target and leaves a possible false break higher

As can be seen in the chart above NZDUSD just like AUDUSD has hit a major extension target and in doing so has broken through the resistance of a rising channel. This may have left a false break higher. I now favour a return to the .6900 region and potentially lower. One step at a time. The false break higher will be confirmed on a break below .6900. This kind of set up, if triggered, typically leads to sharp losses.

Sunday 20 September 2009

EURAUD - Follow up chart


Following on from my post below, here is the chart. As can be seen the pair has hit a major extension target and is also exhibiting a multi week bullish divergence. Coupled with AUDUSD having hit a major extension target I would favour a bounce higher towards 1.8098 over the coming weeks. As before, below 1.6587 weakens bulls.

Saturday 19 September 2009

AUDUSD - Possible false break higher.


Well, all I can do is repeat what I mentioned in the update below about USD sentiment. I feel the same way about the AUD as I did when I wrote an earlier post in terms of my conviction and intuition, except this time I have the inclination to be a bear. As some of you may have gathered I am a natural contrarian. AUDUSD has hit a major extension level at .8700 and has formed a rising wedge, which on a weekly chart has been broken to the upside. This break has failed to gain momentum and has also failed to close above .8700 on a weekly basis. All I can say is watch this one and also NZDUSD. These commodity currencies have gone a long way in a short time. If the global economy does not come roaring back then these currencies are going to get trounced. Couple this with the fact that EURAUD is technically set up for a recovery (more on that later) and GBPAUD has hit a 20 year low, this is one currency that needs to take a breather. Look out to see if AUDUSD leaves a false break higher next week. If so, this could be an early indication that there will be swift losses ahead. In my opinion any further rises beyond the .8700 region will just make the eventual fall even more tasty then it is currently set up to be.

GBPUSD - Possible reversal pattern forming


So I am finally getting back into the swing of things after my holiday and am glad to see that one of my earlier recommendations is making the right noises. As per my earlier post, I see GBPUSD as one of the best sells if you are getting bullish on the USD, which I am. Sentiment is rediculously skewed towards US dollar bears and in a debt deflationary scenario the USD will come out on top. I see no reason why we cannot head down to the 1.5500 region initially in GBPUSD and then re-assess there. 1.3500, as I mentioned before, is not as low a probability as you may believe. On the weekly chart above (click on image for a larger picture)there is a potential reversal pattern forming which will be triggered on a push under 1.6113. I would suggest getting short on pullbacks now but those who love their technicals and like to play it safe (and ultimately probably sit through more pain) may want to sell on the break. Good luck.

Thursday 17 September 2009

EURAUD - Recovery higher likely

EURAUD has hit a major extension target recently and is also exhibiting a multi week MACD bull divergence. I will try to upload a chart tomorrow or over the weekend. I just wanted to get the message across that I think that it is a great long with stops below 1.6587 (01 Jul 08 high). All will become clear when you see the charts. My reasoning here is that the so called global recovery has got way ahead of itself. Folk are talking of rate hikes in Australia. If signs emerge that all is not well the currencies that will get the biggest kicking are the commodity currencies and in particular AUDUSD And NZDUSD. To play it safe I have chosen this trade as I see a good technical set up too. Good luck if you have a go. Trade has potential for 1.8104 (13 Jul high) initially. this is one of the rare occasions where I see no harm in simply hitting market.

Wednesday 16 September 2009

Idle container ships - My very own picture


Following on from my post below I would like to direct readers to Michael Shedlock's piece on container ships here. Also check out my very own photo from souh east asia....

NSEI vs p/e ratio - An update


I have had a few requests for the chart above. We are now back at levels in the p/e that in 2004 heralded a pullback. I think the Indian market is getting a tad pricey...


Friday 4 September 2009

Idle container ships - A warning sign.

A small observation I made while eating sea food on the east coast of Singapore was the number of idle container ships that are anchored off the coast of Singapore. I was reliably informed by those that I ate with that if you can see the pink underbelly of the ships; it indicated that they have no cargo and are likely idle. I saw a lot of pink. Infact every time I looked out to sea, no matter which coast I was on, I saw a lot of pink. This is surely a warning sign that the global economy is still sluggish and that the inventory re-build is nearing completion.

I have since shared e-mails with a friend in the shipping industry in Singapore who tells me that the industry is still not in a good shape. Make of it what you will, but to my mind it does not bode well.....

Thursday 3 September 2009

Back from SE asia

I have been away on holiday in SE asia and have returned to find myself naturally waking up at 4 in the morning, oh dear. I will try to update over the weekend but in any case I can already say that I remain a USD bull and an equities bear. Happy trading....

Monday 10 August 2009

Adam Posen has an impact on the MPC

As per the following link it appears that others are also thinking along the lines of my recent post. Check out this Telegraph article.

Sunday 9 August 2009

Emerging versus developed equity markets - An update.


As was explained in my post below I believe that the risks in US equity markets are skewed to the downside at current prices. I thus contunue to think that anyone with the long emerging versus short developed trade should consider reversing it as per the evidence in the chart above. Basically if equities in general are set to weaken then developed markets will outperform their emerging cousins.

GBPUSD - The probability of a return to 1.3500 and then lower is not negligible.


As returning readers will know I have been prematurely bearish on cable a couple of times. However, this is not going to stop me from getting even more bearish again! The price action seen in GBPUSD and infact in all currencies versus the USD on Friday suggests that there is likely to be a pause in USD weakness and even possibly some strength (my favoured outcome). This ties in to equity markets too. The S&P 500 has now met the 38.2% retrace of the fall from the highs back in 2007.

I agree with the analysis provided by David Rosenberg via Michael Shedlock which you can view here, that the S&P500 is now priced for perfection and that the probability of perfection is as good as nil. I am thus inclined to think that risks are heavily skewed to the downside in equities and thus my USD bullish stance as per my prior post. So what has this got to do with cable? Well, I think that if there is a return to USD strength that it could be a substantial move and that the probability of a return to 1.3500 is a lot higher then is currently priced in and infact a target closer to 1.2600 is even feasible.
The Bank of England have recently hired a new MPC member by the name of Adam Posen. If you pressed on the link you will have learnt that he is an expert on Japan. Furthermore we should not have been surprised to learn of the expansion of the QE program last Thursday. What I am pointing out is that I believe that the BOE percieves the risk of a Japanese style deflationary spiral as far greater then they even want to admit to. As has been alluded to time and again on this blog that is my belief too. So ask yourself this; with the amount of public and private debt outstanding in the uk does cable deserve to be near 1.7000? The bank of England has not hired a Japanese expert by chance. This is essentially an admission that the probability of a Japanese re-run in theUK is far greater then most believe.

As can be seen on the chart above cable has failed to close above the 61.8% retrace of the 1.8672-1.3500 fall. This maintains bearish structure and leads me to favour a return towards 1.3500.

Saturday 1 August 2009

India's Nifty Fifty - Another good shorting opportunity


As per my earlier posts, some of you will know that I am short term bearish on the NSEI Nifty 50. I think that that the closing levels seen last Friday offer another good short entry point. For a return to the 3600 region. Above I am showing the index versus the p/e ratio for those that are interested and follow such data. I would place a stop above 4970. Good luck to anyone who has a go.

Thursday 30 July 2009

Great Letter from an FT reader.

Take a look at this letter from an FT reader in the paper's correspondence section. I share Mr Lachman's sentiment entirely.

Some trade recommendations - Basically buy US dollars

Apoplogies for my failure to post recently, it has been a combination of sitting on the sidelines and working like a dog. Getting up at 5 every morning means I have little energy left for this blog. Sorry! Although I don't have any charts at the moment due to a data issue I have some trading recommendations. They are as follows:

1. Sell NZDUSD on pullbacks towards .6600 with an initial target at .6100 and a stop above .6750

2. Sell AUDUSD if it gets to near .8400 with a stop at .8480 and a target initially at .7700.

3. Sell GBPUSD at 1.6680 for a 1.5400 target and a stop at 1.6770.

So as summarised above, haul in some of those good old USD's.

Some other trade suggestions are getting long AUDNZD, GBPCHF and EURCHF.

Good luck and I will try to update over the weekend when I have some more time and up-to-date data, especially on the AUDNZD, GBPCHF and EURCHF front.

Tuesday 14 July 2009

Some great television from Adam Curtis - The Trap

Some of you may be interested in a series by the documentary maker Adam Curtis called 'The Trap'. I saw it when it first came out on BBC2 a few years ago and was hooked. I have seen them a number of times and am overjoyed every time I watch it just to know that there is a documentary maker around who has such deep insight and big picture undersatnding of the world we live in. A must in my opinion for any Macro investor, or just those of you that are intersted in the world that you inhabit and simply wish to understand it, or see another persons view.

Part 1:


Part 2:


Part 3:

Sunday 12 July 2009

GBPUSD - Price action hints at a correction towards 1.5200


Looking at the above chart we see a rising channel formed which was followed by a false break higher. This has led to near-term weakness. I favour a continuation of this weakness but favour it to stall near 1.5803. This may then provide a selling opportunity on a bounce back towards 1.6500/1.6600. Stops should be placed over the annual high at 1.6745. Medium term I favour a correction towards 1.5200. Click on chart for a larger image.

Nifty 50 p/e ratio - Brief update


Above is a chart of the NSEI Nifty 50 on a weekly basis including the p/e reading in the lower half so that readers can follow the link between the two. As per my prior posts I see a retrace towards 3600 before the possibility of thinking about getting long again. This also ties in nicely with my post below about a hint at the change in perception of global growth. I will try to update my developed vs emerging ratio too.

EURAUD and GBPAUD hint at direction of global economy.


This post is essentially just an observation of reversal patterns in both GBPAUD and EURAUD which can be seen in the two charts above, together with targets. Click on charts for a larger image. Both have broken over necklines although GBPAUD has yet to close above it. My own bias is for a continuation of the recovery in both pairs and as per my earlier post the volatility breakout in GBPAUD may be taking place.

So assuming that there is some more upside say for the next few weeks at least, what does this tell us about the near term perception of the strength of the global recovery? If both GBPAUD and EURAUD are biased higher then we are arguing that EUR and GBP will outperform AUD. This is clearly not a play on global growth. Thus my observation is simply that certain markets are beginning to price in a hint of a reversal in optimism about global growth in the near-term.

Saturday 4 July 2009

Inflation vs deflation - which is more likely?


Once again I am taken back to my youth and my fathers wise words that extremism breeds extremism. This leads me to follow on from my recent piece about deflation, bond yields and equity markets. During my morning snooze I found myself contemplating my existence and pondered how true it is that extremism breeds extremism and we all know how markets like to push for extremes.....

As often happens I wake up and I have a trade idea in my mind and in this case it was selling GBPUSD and it occurred a few days ago (no jokes). I may return to that in a later post. Digging deep into my subconscience I believe the idea was linked to an FT article that I had been reading on the train home some weeks ago about how large the state is now as a national employer. Thats right, unbridled capitalism got us into this mess but now we are left with a huge proportion of the workforce dependent on the state..... The UK is a socialist state.

Now, we also know that over the last few decades the shift in power from workers to corporations has accelerated towards the corporation. This has led to concepts such as outsourcing and as a result stagnant to lower wages with only the chosen few milking the system at the expense of the rest. As with all things, I believe we are simply in a perpetual cycle and now is the time for a swing back to power to workers and away from the corporation. In economics we would say from capital back to labour.


So what we know is that the state is being choked by it's own debt with more to come, it is also the largest employer in the country and it is likely that we get a swing in power back to workers (I don't wish to use the word labour as it may be confused with the political morons that are in power). So under these circumstances, which is more likely to manifest itself, inflation or defaltion? Ask yourself who gains the most if deflation sets in. Number one on the list of those who gain would be the state. As yields fall on government debt and in time that debt is rolled over at lower coupons, the amount of tax income that is used to service the debt holders is reduced and so more can be ploughed back into the economy. Secondly the most astute consumers who have not taken on any debt will also gain as should be the case, those that were not greedy and did not take part in the madness should be rewarded. Does the state favour an inflationary scenario or a deflationary one?


So for all the talk of inflation versus deflation, just ask yourself who gains in each scenario and who is the country's biggest employer. The power shift back to workers is coming and with it so will deflation. In time, as we know only too well, extremism leads to extremism and so a swing from deflation to perhaps hyperinflation may come some day, but give it a rest for now, we are nowhere near having to worry about inflation.

Tuesday 30 June 2009

Nifty Fifty - Possible head and shoulders top


This set up is actually better seen by looking at the Sensex as the neckline was tested as resistance today just perfectly, but I do not have access to the data today! In any case there appears to be the potential for a head and shoulders top with a target back at the 3600 region close to where I initially targeted. It should be initiated on a push below the neckline or 4143.25 to be sure. This is the scenario that I favour, so good luck to all those who have a go!

Monday 22 June 2009

OMX - First signs that the bears are taking control


Following on from my earlier post on the OMX, today's price action definitely shows the bears are beginning to take control of this market. As can be seen in the chart above (click on chart for a larger image) the OMX has had a false break higher to 810.03 followed by weakness which has broken minor trend-line support and also closed below 755.53. This now warns that bears are in control and as detailed in my earlier piece I still favour a fresh low in this market.


Sunday 21 June 2009

BUND - Possible reversal pattern


As is detailed in the chart above we have seen a bullish false break lower in the Bund on a daily chart and a reversal pattern has formed. A break over 120.00 will trigger further gains towards 122.00 and possibly higher. I have also shown the Dax in the lower portion of the screen to highlight the general inverse relationship. So, with that in mind, could the movement in fixed income be signalling the end of the bull run in stocks? For further thoughts on the links between bonds and stocks take a look here. Also, as an after thought, the Dax has broken out of a well defined bullish channel to the downside......

EUR Index - Possible technical signs of weakness


For a change I thought I would take a look at the EUR index as I always focus on the USD Index. The EUR index is interesting as it is has been trading in a symmetrical triangle. There was a bullish false break lower which occured in mid April, however strength has since failed by old trend-line resistance and has fallen back below the old support. If this break is maintained and given that the EUR is the biggest component of the USD Index this perhaps gives extra weight to the possibility of USD strength in the pipeline. A decisive break under 114.983 will signal medium term weakness in the EUR. As always, click on the chart above for more details.
Most of us are aware of the failure of many European banks to give any insight at all into the state of their balance sheets. Industrial production continues to be poor in Germany and most ECB bankers seem to be on a different planet from the rest of us. If there is no demand from elsewhere it does not matter if you have a low level of consumer debt (ie Germany), as somebody still needs to buy your products. Also, given the stubbornly low levels of inflation in the eurozone, it seems to be setting itself up nicely for a Japanese style lost decade. If you're suffering from deflation what you need is a weak curency not a strong one, therefore I am biased down for this index.

Saturday 20 June 2009

GBPCHF - Extension higher favoured.


GBPCHF has broken above the pivotal level of 1.7490 as mentioned in my prior post. Given the shallow retrace to 1.7120 and swift rejection lower seen last Thursday I see a long position as a good diversification of being short EURGBP. This ties in with a medium term view that EURCHF is headed higher, although I would not rule out a swift return to 1.4800 in EURCHF before substantial strength higher. Fundamentally I see the reality of the world economy as being much the same as it was back in 2007 when the mayhem began. US consumers, the linchpin of the global economy, are still heavily leveraged. Given that the US consumer is not coming back anytime soon this implies that US GDP will do the same and with it earnings expectations for the S&P500 are probably a tad too optimistic . In this scenario the tug of war between two currencies like the Swiss Franc and Sterling just turns into a technical arguement as to which one is the most overextended on the downside given their dependence on finance. My opinion is clearly in favour of Sterling although this may begin to change if and when I see EURGBP at levels below .8223 and GBPCHF over 1.9000. In the meantime I favour extensions in both currency pairs, although cable may be capped around 1.6685. In terms of targets for GBPCHF please refer to my prior post. A push back below 1.7120 however warns of an end to strength and it would be wise to take a step back and re-assess.

Nifty 50 - Brief update and trade recommendation


The Nifty almost touched the bottom of the range of values at which I recommended to go short namely 4700 - 5000. As can be seen in the chart above it now trades just above trend line support. It is possible that we get a bounce from here that may give another shorting opportunity within the afore mentioned range. Given the price action in the S&P 500 I still favour weakness and combining that with my bias from the emerging/developed analysis below I favour an eventual break beneath this trend line. My ideal scenario is a return to the range that was trading before the post election madness, between 3300 and 3700. I would suggest selling pullbacks up to 4450 with a stop over 4550. Alternatively wait to see if it gets back into the range that was mentioned earlier; the option for the truly safe trader. As always good luck.

Note on links to FT articles

I have been told by a few readers that the links to some of the FT articles I have suggested are taking them to subscription pages. One potential way round this is to click on the link I have provided and then copy and paste the title of the FT story into a fresh google search and then look for the FT article amongst the search results (should be in the first 5 or six). 50% of the time you get to the article you wanted originally but without the subscription garbage. Hope this helps some of you.

Monday 15 June 2009

Developed versus emerging markets - Can we learn anything from their relative movement?


Above you can see three charts all in the one frame. The orientation of the data is as follows, starting from the bottom we have the Morgan Stanley Emerging markets index, above that the World index from the same provider, and right at the top we have the ratio of the two, calculated by dividing the value of the emerging markets index by the world index (developed markets).

As the ratio rises this is showing you that emerging markets are outperforming developed markets and this has been the case since the end of October last year when the emerging market index bottomed. Note that the world index made a fresh low after October, in March which was not matched by the emerging world. Conversely when the ratio falls the opposite is true. In that case developed markets will outperform.

Although I appreciate there is not a lot of history we can see that when the ratio hit these levels last year it marked a high point for equities and the end of the outperformance of the emerging markets. Given my view on some emerging markets and India in particular I think that we could see outperformance again in developed markets. I feel that the S&P must at the very least test the low that was made in March, be it a 50%/60% or greater retracement. If that is the case emerging markets are not the place to be in the short run.


I would like to stress that I am a long term bull on the Indian markets in general, but feel that we have gone a long way in a short while on essentially hot air as per my recent posts.

Thursday 11 June 2009

The Coppock Indicator - A great article

I'm sorry about the lack of original ideas at the moment part of it is down to me waiting for a resolution to the S&P 500. Along those lines take a look here at a letter from the FT today. I've been reading a lot about talk of this indicator recently and found this letter highly relevant.

will update more at the weekend.

Sunday 7 June 2009

A good article on where we are economically from a global perspective.

Another one from Ambrose Evans-Pritchard at the Telegraph: Take a look.

OMX, Swedens stock market - Weekly structure suggests further downleg


Continuing from my post below about the USD index, I feel that the OMX cash index has a very clear bearish structure which will only be broken on a rise over the 801.54-816.35 region. However, while below this area there is a large probability that we make a fresh low below 556.77. This also offers a clear trading opportunity with a great risk reward profile. I would suggest selling at market or on pullbacks under the above mentioned region. Your stop is clear (over 801.54-816.35), and the initial target is 556.77. Good luck!

USD Index - Has it bottomed?


The USD index has bounced from close to the 61.8% retrace of the prior rise. Could this possibly be a turning point for the Index. If so it could also mark a turning point for equity markets as the USD being bid will probably be associated with stress in risk markets.


My own view given positioning in USD shorts is that we are close to a turning point. For the purposes of this blog I am simply pointing out that, as before, the USD index may be key to direction elsewhere.

Wednesday 3 June 2009

Richard Koo - FT today

Great article from Richard Koo in the FT today. He sums up what I have been discussing in a couple of recent posts about what a waste of time S&P is in the medium term (http://you-buy-the-high-i-sell-the-low.blogspot.com/2009/05/if-s-had-rating-it-would-be-junk.html). Check it out:

http://www.ft.com/cms/s/0/c3654cdc-4f88-11de-a692-00144feabdc0.html

GBPAUD - Divergence implies strength ahead


As can be seen from the weekly GBPAUD chart above there is a rather large weekly bullish divergence. Given the over extended nature of the recent bounce back in AUD, I think this trade can be justified. I also see a volatility breakout on the horizon and given the divergence set up I favour a push higher. Move could be fast brace yourself.

Monday 1 June 2009

AUDNZD - Opportunistic trade recommendation

Just been looking at the AUDNZD chart and would suggest buying on pullbacks towards 1.2400 with a stop under 1.2300 and a target back at 1.2940. Good risk reward and great fundamentally and technically. NZDUSD may have also completed a symmetric correction. Perhaps more on that tomorrow. Goodnight!

Interesting - Yield curve spread and equities

Good piece on The Big Picture that ties in with my piece yesterday about the rise in 10 year yields and the movement of equities. Take a look:

http://www.ritholtz.com/blog/2009/06/relationship-between-the-210-spx/

Sunday 31 May 2009

Do anything in haste and repent at your leisure.

My mother often used to say to me; "do anything in haste and repent at your leisure". As a trader I have learnt the truth of this phrase. Any trader out there will appreciate the impact of this saying, when he/she has jumped into a market on an impulse and then had to take a stop and nurse the psychological wounds at their leisure. Well, in much of the developed world we have all become traders, betting on house prices, pension funds and any asset that will yield to the ravages of leverage. Well at least that was the way it was until recently.

So lying in bed I thought what picture could I use to encapsulate the title of this particular piece and from out of my subconscience came a floating monthly chart of the Nikkei. Perfect:


So where is this all going you may ask. Well there has been a lot of press about the rise in US 10 year yields. This got me thinking about how sustainable the current bond yield move is. What followed in my mind was a philosophical debate about what deflation actually is. Big picture, I believe that deflation is a way of controlling the animal instincts of fear and greed that lead people to flip houses, bid up tulip bulbs and price palaces in downtown Tokyo at values greater than the state of California. It is a mechanical restorer of equilibrium, but it takes time. As can be seen in the chart above, after the initial collapse in the Nikkei in the late 80's there have been many false dawns where the animal instinct has been beaten back and my mothers wise words have been repeated. Could it be that every time the Nikkei rose, the bond market sold off, as this was perceived to be the beginning of a new bull market? Then yields got to a point where, deleveraging became slower and began to hamper the economy (again) thus setting off another mini-crisis and fresh lows. If you are a zombie bank and the rate at which you can roll over your debt suddenly rockets any hopes of expansion and new hiring are thrown out of the window. Consumers who have mortgages also begin to feel the pain.

The point I am trying to make here is that the biggest credit bubble in the history of the world cannot be cleansed by a group of central bankers buying shed loads of bonds. Mr &Mrs consumer and the corporations that employ them first need to pass through years of balance sheet repair. It is thus my assumption that, as happened in Japan, we will undergo further setbacks which will drag yields lower until we are all in a position to comfortably pay down debt. It is essentially a self induced viscious cycle where premature risk taking stokes the animal instincts that have not quite been extinguished from the last pasting, the herd jumps in and then yields rise and ooops premature tradeaculation, those yields at what would, in a historic context, be considered low levels, lead to a reversal of enthusiasm and back down we go. Eventually you have had so many beatings your psychology changes and the end result is a chart called the Nikkei.

The alternative is a biblical style of debt cleansing where the consumer and corporate debt slate is wiped clean. How would our high street banks feel if we just walked away from our debts, well for a start they could not pay their staff wages. You get where this is going. So deflation forces upon us a Yin phase in the economy (see post below), where yields stay low for a long time but despite low interest rates nobody wishes to leverage themselves up to the eyeballs. So you only need a few false dawns as happened with the Nikkei and pretty soon phsychology has changed and we are all left reflecting why we jumped in so soon. Why did we not listen to our mothers!

Another phrase my mother used to say to me was; "if you can't say anything nice, don't say anything at all". Sorry mum.

Saturday 30 May 2009

Nifty 50 P/E update


As a follow up to my post last week on the Nifty 50 I noticed yesterday when looking at the chart that the p/e ratio got to around 22 in the initial recovery following the dot com crash. By my calculations this should correspond to a level on Nifty at about 4700. I would recommend going short inbetween 4700 and 5000 for a return to 3600 initially.

Stops could be placed over 5300.

Friday 29 May 2009

The Yin phase of the economy

It seems that I am not the only person who gives some credence to Richard Koo's work, as detailed in http://you-buy-the-high-i-sell-the-low.blogspot.com/2009/01/good-read-holy-grail-of-macroeconomics.html, I think we can learn a lot from the experiences in Japan. The following link written by Carl Stick acts as a good summary of the afore mentioned book. Check it out:

- http://www.telegraph.co.uk/finance/personalfinance/investing/shares/5403059/Stock-market-Were-in-the-yin-phase.html

Wednesday 27 May 2009

Stock Markets - Some random thoughts

Consumer confidence stats that came out yesterday signify hope not confidence. Even if we have made a bottom it will need to be tested. When that does occur it is more likely to be a deep retrace, and the USD will probably strengthen. There is a high likelihood that S&P starts downgrading commercial mortgage backed secuities so a credit event may be associated with any such correction. (Not that we rate S&P, we just know that they move the market). So I'm simply advising readers to keep their eye's peeled and watch that USD Index, see http://you-buy-the-high-i-sell-the-low.blogspot.com/2009/05/nzdusd-is-it-really-that-good.html, (which is actually about the USD Index despite the title!). The USD may be offered now but when I hear rumours in the market, as I did today, that Geithner opposes a strong dollar, I sense that someone is trying to get filled. It turns out to be a false statement from Geithner.

EURGBP - Breaks below the 200 day moving average


Today EURGBP has traded below the 200 day moving average for the first time since last October. According to my own studies this is occurring at the same time as a volatility breakout. As returning readers will know this is a trade that I like both technically and fundamentally. Technically the pair has become over extended on the top side and the fundamentals are much the same as when I first wrote about the pair in the past, so please refer to:


That's right I'm a bear! In the chart above I have detailed some targets. I would suggest getting short around .8723 the recent low that was broken today with a stop over .8790, for the short term players otherwise a stop over .8870 for those looking to blow the lights out. Its always nice to blow the lights out!

GBPCHF - Approaches 1.7490 pivot


As regular readers may have noticed I have ditched the idea of just mentioning trading ideas as I feel that the chart adds so much to the narrative, so decided to continue as before.

Sterling has been the star performer of late. As mentioned in prior posts I am a EURGBP bear and due to my medium term bullish stance for EURCHF I become a GBPCHF bull. Looking at the chart above it can be seen that the pair has recently broken clear of resistance and is now trading close to the crucial 1.7490 region. It is my view that this level will act as a pivot with a break over 1.7490 ending the the downside hopes of many. I favour an eventual break higher and have an initial target at 1.8215, then 1.9100 and finally the potential for 1.9685.

I would suggest trying to get long on pullbacks towards the old resistance turned support near 1.6950, with a stop under 1.6625. Click on the chart above for more detail. Good luck.

Monday 25 May 2009

Great Post about the failure of economists

Last November the queen of Great Britain asked why nobody had seen the economic crisis coming, and was told by an LSE professor; "At every stage, someone was relying on somebody else and everyone thought they were doing the right thing." Maybe all she need do is look at her old honours lists and see that the leaders of most of the banks operating in her territory deserve a good questioning. Top of the list she would find the now infamous Sir Fred Goodwin. Perhaps she could ask him? Along these lines, see the following:

http://www.financialarmageddon.com/2009/05/largely-on-the-mark.html

Although there is no evidence on my blog, as it is too new, I can assure you it was as obvious to me as it was to Michael Panzner that there was an almighty imbalance building and that the amount of consumer debt was unsustainable. We were at the top of a minsky cycle.

Sunday 24 May 2009

India's Nifty 50 - Too fast too soon


Yet another market can be described as going too far too soon. As was described in my prior post http://you-buy-the-high-i-sell-the-low.blogspot.com/2008/12/indias-nifty-fifty-recovery-favoured.html, I was bullish, however when I look at the p/e ratio on a weekly basis which has previously acted as a reasonable indicator of overbought/oversold condtions, it seems that we are getting close to levels where you would want to be medium term short of this market. So here again is a market that makes me think that recovery hopes have gone too far too soon. I would be a seller here for a minimum return to the to the 3600 level.

As can be seen on the p/e chart above, the P/E ratio broke over 20 last week and readings over 23.5 have typically been associated with markets set for a correction lower. Somehow seems a little too quick to be up at these levels already?

If S&P had a rating it would be junk


Well it seems that S&P's announcement has had little effect on Sterling. I must admit I have sympathy with the price action. Afterall why should we trust an organisation that got it so wrong on the way up to tell us how things are on the way down. Ultimately they are a corrupt organisation who's influence on the market is far too great. Over time S&P have managed to get their ratings into various bits of legal documentation that stipulate what can and cannot be held in various funds. It is via this route that they still exercise such influence. If major sovereign downgrades do occur it will be for the better, because with it S&P may find that they instigate their own demise. In the long run Japan proved that you don't need to bother with S&P. And hopefully the investment community at large will conclude the same. Of course an equivalent independent organisation that is not funded by those that it rates would be most welcome.


That said, as someone who lives in the UK, I do appreciate that the debt burden on the state and the consumer is considerable, but is it really that much worse then other major economies (US, Germany, France). We are all in this together and that is why I think that the markets shrugged off the initial knee jerk reaction.


In the short run I remain a EURGBP bear simply due to a major over-extension on the top side. In time I hope to do an update on this too. Back to cable. The price action is exhibiting some initial signs of exhaustion, so given my view on the USD I feel that the region around 1.6055 could act as a decent area for shorts with a return to the 1.5000 region initially. Where to place a stop is down to the individual trader but a minimum 100 tick stop is recommended. To get at least a 2:1 ratio you could place one over 1.6400 too.

Saturday 23 May 2009

NZDUSD - Is it really that good!


The movement in the Kiwi of late has led me to take a closer look at the USD index. I cannot help but think that the movement in the Kiwi is analogous to the madness in the financial sector where crap is being bought up as part of a massive short squeeze, with some buyers no doubt thinking they are snapping up a bargain.


Markets can certainly stay irrational longer then those trading can stay solvent. Anyhow looking at the USD index I feel that it has undergone a very healthy correction and although there may be a touch more to come, it could well be time to think about buying some US dollars again! In my view equities are due a correction and for what it is worth I am not in the V shaped recovery camp. I would like to point readers to the following which sums up my views well:


Now take a look at the above chart of the USD index, it has retraced close to 50% of the initial recovery and looks to be in a decent position to at least begin a period of consolidation. Although I am not a believer in armageddon, as per my prior posts, I do not think we are going back to the glory days that were driven by excess leverage either. The US consumer is fertig and thus in time the US current account will repair itself. Isn't this the main reason that the USD was sold off. It was at the center of most arguements that I can recall.


As an example, the movement seen in GBPUSD which I will follow up with in a post, looks set to exhaust itself, and I would recommend going short soon. This is just one example of currencies that have gone a little too far a tad too soon versus the USD, a bit like the S&P500. Who knows, maybe the inverted head and shoulders may work this time!

Contact details

Greetings to anyone who is still reading this blog after the many days that have gone by without updates. I now have an e-mail address that you can use if you wish to contact me; greyheroninfo@gmail.com. Updates to follow shortly.

Thursday 16 April 2009

I forgot to explain my NZDUSD Sell!

Well the content of my last update pretty much sums up the state of affairs in my current existence. I forgot to explain my selling bias! Everything is a rush right now. I have decided that the only way that I can continue with this blog is if I simply update quickly when I have a trading idea and for the moment forget about charts etc. On that note I can see a decent set up in GBPAUD buying ahead of 2.0300 for 2.2825 potentially with a stop and reverse under 2.0230 (the recent low), with projected traget in the low 1.9000's.

NZDUSD looks good for the .5300 region. I see a little more strength left in Aussie (AUDUSD), but a pull back is imminent. Given that AUDNZD is trading in a rising channel it would seem likely as things stand to expect a less severe pullback in Ausie perhaps to the .6900 region.

GBPCHF looks very solid and has a lot of upside and EURGBP looks set to revisit .8233. EURCHF is likely to rise but still has the potential to dip down to 1.4900/1.5000, but never-the-less medium term bias is definitely higher.

Will try and post some trade recs next time. I will aslo try and set up an e-mail address so that other serious traders can contact me should they wish to.

All the best and happy trading.

Monday 30 March 2009

Will update soon

Apologies to all readers of this blog, I have been very busy organising various issues but hope to be in a position to update soon. Please be patient some commentary should follow in due course. I have an NZDUSD trade brewing all I can say right now is that .5820 looks like a great short entry point, will update with a chart if I get the chance...

Sunday 15 March 2009

AUDNZD - Bollard talks up the Kiwi


In a recent Bloomberg interview with RBNZ governor Bollard, he hinted at there being an expected further 50 basis points of easing in the pipeline. He also spoke about the Kiwi being sufficiently weak to make New Zealands exports competitive again, suggesting that it was commodity prices that needed to fall. This has weakened the technical picture following trade on Thursday/Friday last week.
I Have cut my AUDNZD position in half with a stop for half of the remainder under 1.2395 due to this level leading to a breach of the rising trend line since 1.0630. There are likely to be stops both above 1.2970 and below 1.2395. It is clear which one's are most in danger. I thus take the view that it is safer to buy the top if AUDNZD finds strength, rather then holding onto longs. In any case I feel that fundamentally the pair should continue to trade above the 200 day moving average, and that 1.3600 is much more likely than 1.0630.

If you managed to get long AUDNZD when it was first recommended on this blog you should have made a tidy profit. There will be more opportunties, and it could yet break higher, you just have to protect what you have in the bag to a degree, but stay in the game, albeit to a lesser degree. Good luck

Tuesday 10 March 2009

USDSEK - Diamond top warns of further losses


USDSEK peaked at 9.3325, extremely close to a major extension target at 9.3335. In the process a diamond top has been formed. I can assure those of you that cannot quite see the formation that on a 4 hour chart it is clear. Typically when these patterns are triggered, which this one has been on the push under 8.9990, they lead to substantial losses. If USDSEK does follow through with more losses this would fit in with general USD weakness which implies increased global liquidity and a likely return to risk, i.e higher equity markets. The fact that this pattern has formed so close to a major extension target just makes it more potent. Losses could potentially extend down to the 7.3800 region. I would suggest selling on pullbacks with a stop above today's high at 9.2360.


I appreciate that the Swedish economy is exposed to the baltic states via the Swedish banking system, but then which banking system isn't exposed to regions or elements that weaken their respsective balance sheets . USDSEK is technically easy to read for me that is why I have chosen it. Ultimately this one is driven by the technicals.

Sunday 8 March 2009

GBPJPY - Extension higher favoured


As mentioned in my post http://you-buy-the-high-i-sell-the-low.blogspot.com/2009/02/gbpjpy-does-major-exporting-nation.html GBPJPY has indeed shown strength. The break above the neckline as shown in the above chart now targets our initial level near 158.00, however the recent structure is also typical of a substantial extension higher and could wind up targeting the 159.00 region.
This may tie in with USDJPY reaching it's double bottom target near 102.00. In any case both USDJPY and GBJPY look positive short term.

USD Index - Possible false break higher; but too early to tell


Recent price action has broken out of the rising wedge that was mentioned in last weeks post. To confirm this as a false break higher will require a push below the trend line shown on the weekly chart above (Please click on image for a larger chart). Some individual currency pairs are showing signs of having met extension targets, namely USDSEK and possibly GBPUSD. A fall under this trend-line will trigger a decent correction lower. As mentioned below I am focusing on the USD Index as i see it as the key to movement in so many other markets, and until this resolves there remains uncertainty in initiating too many new positions.

Monday 2 March 2009

USD Index - A rising wedge?


Are we forming an ending diagonal in the USD Index? As can be seen in the daily chart above (Click on chart for larger image), there appears to be a rising wedge formation in the USD Index. If this wedge breaks to the upside, look for a false break and then the USD should weaken. However without the false break it is just a continuation pattern. This is important as the S&P 500 has hit a major extension target at 700 according to the structure that I see in the market. If this coincides with a false break higher as described above, this could be a very useful indicator to near term movement. Watch that Dollar!

Sunday 1 March 2009

AUDNZD - A new monthly candle


Here is an update of the big picture view of AUDNZD. I have little to add on my stance. I contine to be bullish for all the reasons highlighted in previous posts on this blog. Recent economic statistics continue to be more positive for AUD than for NZD. If the combined technical and fundamental evidence does not manage to force a break of the wedge, then it is unlikey to ever happen. There is currently no reason to see why the favoured scenario should not pan out, but as always stay vigilant. A break of 1.2970 will target the 1.3600 region close to the old 2000 high.

USD index - key to direction


Above is an update of the USD index following on from my post http://you-buy-the-high-i-sell-the-low.blogspot.com/2009/01/usd-index-chart-will-reversal-pattern.html. Technically the reversal pattern has been triggered as both the neckline and last November's high have been broken. However, I cannot help but think about analogies with the Japanese Yen. The Yen is currently being sold off as it is realised that a strong currency is inconsistent with the economic statistics. Also Japanese investors are not repatriating in anywhere near the volume that they have been recently. This leads me to conclude that deleveraging is perhaps slowing down. Thus, can we assume that real flows due to deleveraging are likely to diminish in other currencies. It is my opinion, that if we make this assumption, then it is hard to justify that the pattern described above will meet its objectives, in the sense of a clean technical projection (although it may happen over a prolonged period when the pattern may no longer be valid). I personally favour a period of USD weakness before further strength may resume.
I highlight the USD index here as I feel that so much in the markets are reliant on the movement here. Further USD strength will most likely trigger more losses in the S&P 500, due to the effect on repatriated cash flows by US companies. This will probably drag down other equity markets. So Dollar bulls, like Yen bulls, should be careful what they wish for, as excessive dollar strength is inconsistent with a realignment of the US economy to net exports. I do however appreciate that someone must have a strong currency if counties like Japan and Germany have weak ones. The global economy is still dominated by the US, although not as it was say 10 years ago, so recovery there is still paramount if any place else is to see stability.

Sunday 22 February 2009

On Holiday!

I'm currently on Holiday and will be back on Monday/Tuesday and possibly in a position to make some fresh posts. Although I have not been following markets as thoroughly as normal I have managed to read a few German papers and see that the Yen is moving in the right direction. AUDNZD also looks set to have a go at last years high. So good luck for tomorrow.

Sunday 15 February 2009

European banking system - A potential stress

A good read from Ambrose Evans-Pritchard:

http://www.telegraph.co.uk/finance/comment/ambroseevans_pritchard/4623525/Failure-to-save-East-Europe-will-lead-to-worldwide-meltdown.html

Not sure about the world wide meltdown, but he has some good points.

Enjoy!

USDJPY - Will it mimic the USD during a period of weakness?


As mentioned in my post below, I view the strength of the Japanese currency as excessive now. I also note that as the USD has been strengthening the Japanese Yen has been strong, being one of the few currencies that has not weakened versus the USD. If the USD were to weaken again for a period would the JPY weaken with it? Take a look at the chart above. JPY has broken out of a daily trend and has the potential to form a double bottom on the break of 94.63. My own studies point to a volatility break out and given my fundamental position I would favour a move higher. You can wait for confirmation of the double bottom or ease your way in before with a stop under 87.11. Either way this one could motor.

GBPJPY - Does a major exporting nation mired with deflation deserve one of the worlds strongest currencies?


GBPJPY is a pair that I have been following for some time as the structure is very clear and a major extension target near 120.00 has been hit recently. On a fundamental basis, the news from the Japanaese economy has been relentlessly dire, yet the nation has a mighty strong currency. I follow the Yen index and there are signs of a turn, but nothing concrete. There is scope for a double bottom in USDJPY, but that has yet to be confirmed. I will post a chart for those who are interested in my next post. You can make up your own minds. Basically, you have an oversold currency, sterling, versus the darling of the currency market the Yen. Japan as an export driven nation, has experienced a massive contraction in GDP recently and this loss of demand and credit is leading to deflationary pressures again, see :


Thus as strange as it may sound a somewhat controversial trade could be a winner; going long GBPJPY. The recent false break out a falling wedge to 118.78 followed by a sharp recovery is bullish. I would suggest going long GBPJPY for a rebound to the 158.00 region. Entry should be around 126.00 close to the 61.8% retrace of the initial recovery from 118.78 with a stop under the low at 118.78.


A repeated theme on this blog has been the role of exchange rates to stoke GDP. Consumption is dead largely due to deleveraging. Investment will pick up slowly once the saving rates pick up in any economy. We are left with government spending and net exports. Given that the Japanese have tried various forms of fiscal expansion over the last 15+ years, and that they are a major exporting nation, one of the few ways to assist the economy would be via a weakened exchange rate versus most other curencies. It's the race to who can have the weakest currency! On your marks, get set, .....................

Sunday 8 February 2009

AUDUSD - One to watch


AUDUSD has been beaten over the last 9 months as a play on global deleveraging and a contraction in global demand has been deemed negative for the core of the Aussie economy; raw materials. As alluded to in my post below trade continues regardless and will just go from crazy mad (driven by leverage) to more normal levels as consumers and corporations continue to deleverage.

Although I am currently of the view that this process of balance sheet repair will take much longer than a few months, I do believe that there is scope for two way movement in markets, hence my short squeeze view in equities and a potential bounce for the Aussie. I do however reserve the right to change my mind as data changes over time!

So although I am not convinced we have seen a major low in the S&P 500 yet I do think that there may be a tradeable bounce in equities down the pipeline. In this scenario Aussie may fair better than many expect. The only element of the trade idea that bugs me is that the USD index as shown in my post http://you-buy-the-high-i-sell-the-low.blogspot.com/2009/01/usd-index-chart-will-reversal-pattern.html , continues to look menacing and makes me think that a test of the neckline is still possible before the dollar weakens. This has already dented my NZD trade idea.

My warning to readers is that maybe this is just one to watch, but it is exhibiting some good signals for an eventual swing higher. See chart above for some positive signs. Click on chart for larger image.

Baltic Dry freight Index - Possible recovery

Firstly take a look at the following: http://www.bloomberg.com/apps/cbuilder?ticker1=BDIY%3AIND . There does appear to be a minor recovery in this dry freight shipping index, and as a result we have seen a turn around in the AUD and to a degree in equities.

The huge amount of leverage that has been unwound on a global scale led to a sharp dip in demand for dry freight containers as large capital intensive projects were abandoned. It would seem obvious that trade will not end, but going forward may just have to return to more subdued levels that are consistent with consumers and corporations that are paying down debt. This does not mean that container ships will never sail again, just fewer of them. Maybe folk will wait for their fridges to break before buying a new one. You get where I'm going....

It is worth noting this turnaround in the index as it may also signal some kind of rational behaviour is returning to the market place. Although I am not convinced that we have seen a short term bottom in equities, the price action is interesting and I do believe that there is scope for a short squeeze higher in equities, hence my piece on AUDUSD which will follow shortly. In any case food for thought.